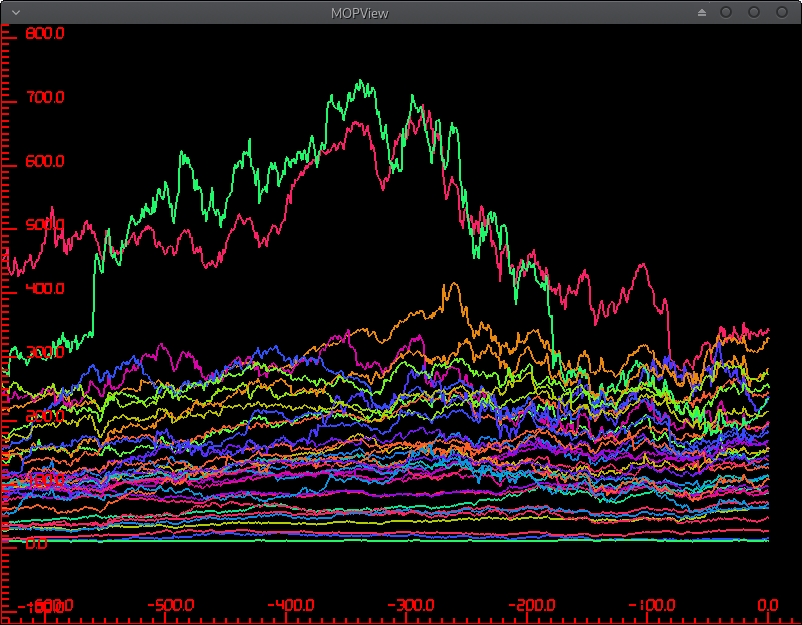
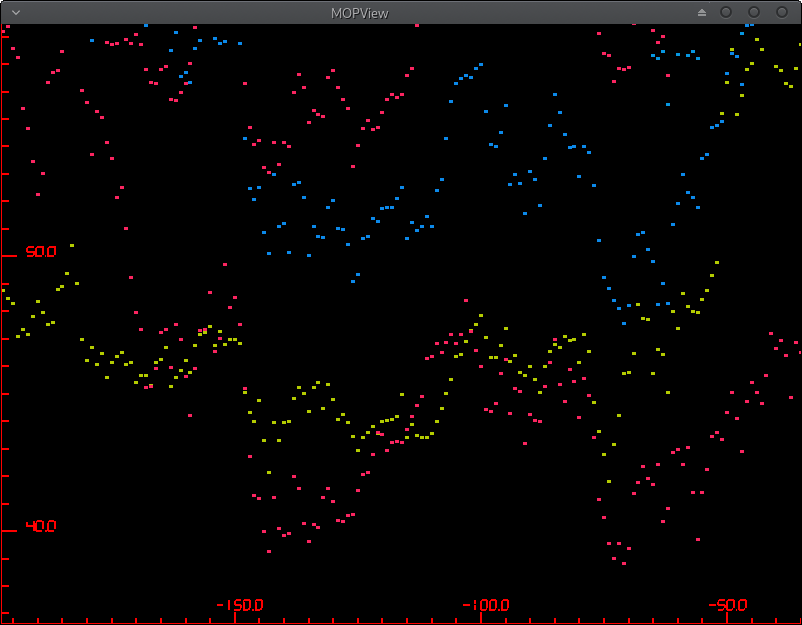
MOPView is the Multitude Of Points Viewer. It plots points (or lines or other shapes) in a hardware accelerated, interactive graph.
The following graph styles are currently supported:
The following data sources are currently supported:
These tools are great for presenting data, but not so good for inspecting large datasets. MOPView lets you quickly pan and zoom into interesting sections, or zoom out to see all of the data. This is possible because MOPView uses hardware acceleration with OpenGL to render the data. As an example, my test dataset of historical stock prices takes 0.6 seconds to render a single image in gnuplot but runs at 60hz in MOPView with an RX 470 GPU. Over 2 million points can be rendered interactively with MOPView using that same RX 470.
You need a GPU and drivers supporting OpenGL 4.1 and GLSL 4.2. About 200MB VRAM minimum is needed, maybe more for large datasets. Testing is done with go version 1.18.1.
Newer Go with modules: Run make to build. MOPView is written in go and the go tools should download the dependencies automatically.
Older Go: Run GOPATH=$(pwd) go get graph to download dependencies, then GOPATH=$(pwd) go build graph to build. Rename graph executable to mopview.
For the record, I did not consent to the decision to completely change the go build system. That's on the go devs at Google.
Configuration is done through a JSON file, which is passed as the only command line argument to the mopview executable.
Example JSON:
{
  "CSVSources": [
    {
      "Filename": "stockprices/AAL.csv",
      "ColumnNames": [
        "",
        "AALOpen",
        "AALHigh",
        "AALLow",
        "AALClose",
        "AALVolume"
      ],
      "RowName": "AALIndex",
      "SkipRows": 1,
      "RowOffset": -4354
    }
  ],
  "ConstSources": [
    {
      "Name": "PointSize",
      "Value": 0.005
    },
    {
      "Name": "One",
      "Value": 1
    },
    {
      "Name": "Half",
      "Value": 0.5
    },
    {
      "Name": "Z",
      "Value": 0
    }
  ],
  "Plots": [
    {
      "Name": "AAL",
      "X": "AALIndex",
      "Y": "AALOpen",
      "CY": "AALClose",
      "MinY": "AALHigh",
      "MaxY": "AALLow",
      "R": "Half",
      "G": "Half",
      "B": "Half",
      "S": "PointSize",
      "Style": "Line",
      "RandomizeColor": 1
    }
  ]
}
Explanation: A graph consists of one or more data sources and one or more plots. A data source is a sequence of floating point values with a unique name. A plot specifies which data source(s) should be used to provide which characteristics of each point, and what style should be used to render the points.
CSVSources A list of data sources that come from comma separated list files.ColumnNames A name for the data in each column. If a column will not be used, you can specify "" and the column will not be stored. Each piece of data is parsed as a float and will be set to 0.0 if parsing fails.RowName A name for the row number. This is useful when your data does not include an explicit X value for each datum.SkipRows Ignore this many rows at the top of the CSV. This is useful when you have some column names or other info at the top of the file.RowOffset The data source named by RowName will start at 0.0 by default, but an offset can be added here. This is useful for making different size datasets line up.ConstSources A list of data sources where all values in the source are the same. This is useful for filling in characteristics that shouldn't change within a plot. A "Zero" constant is created automatically.Plots: A list of plots to render. Any characteristics not specified are set to "Zero" constant. If characteristics have different lengths, the shortest one sets the number of points.X, Y, Z Location of the point. Values should be the name of the previously defined source(s).CY Close price. Only used for Candlestick plots.MinY, MaxY Min and Max price. Only used for Candlestick plots.R, G, B Color of the point.S Size of the point. For Scatter plots this is in screen space, so use a small value (e.g. 0.005). For Candlestick this is in graph units. Not used on Line graphs.Style The type of plot. Values can be "Line", "Candlestick" or "Scatter"RandomizeColor This will generate a random color and multiply the RGB values with it. Set R,G,B to 0.5 and RandomizeColor to 1 for totally random colors. Useful when you have lots of plots and don't want to define all those constants.An example dataset is included in the mopview_example directory, just run ../mopview example.json (from the mopview_example directory, since file paths are relative)
MOPView is copyrighted 2023 by Thomas VanSelus and licensed as GPLv2. See LICENSE.txt
See http://diospyros.us/mopview/mopview.html for the latest. Email mopview at the aforementioned domain with questions or bug reports.